🖥️ Final Screens
Tracka, screen by screen
Browse the actual Tracka screens, from project discovery and community tracking to feedback submission and leaderboard engagement.
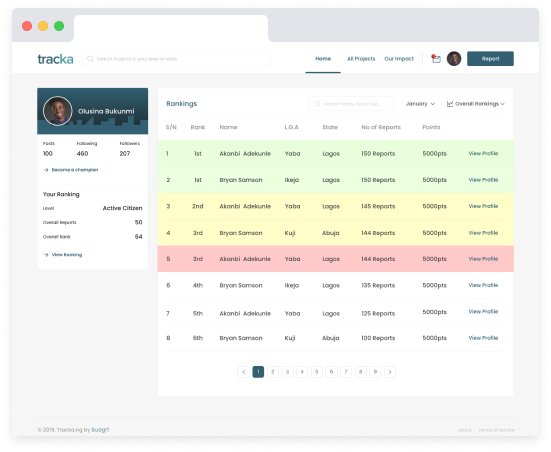
Rankings Leaderboard
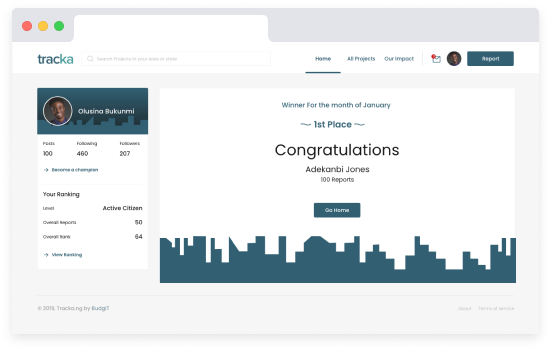
Monthly Winner Announcement
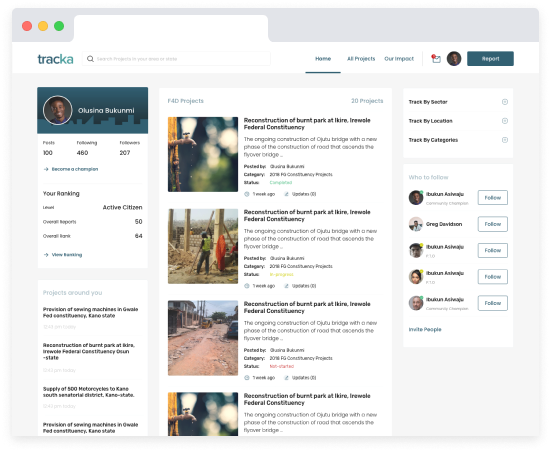
Government Projects Feed
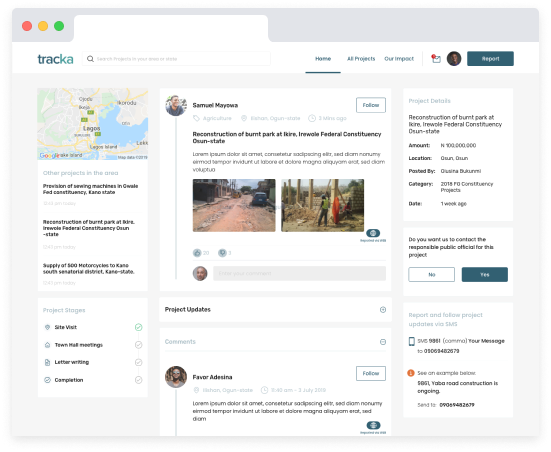
Project Detail and Tracking
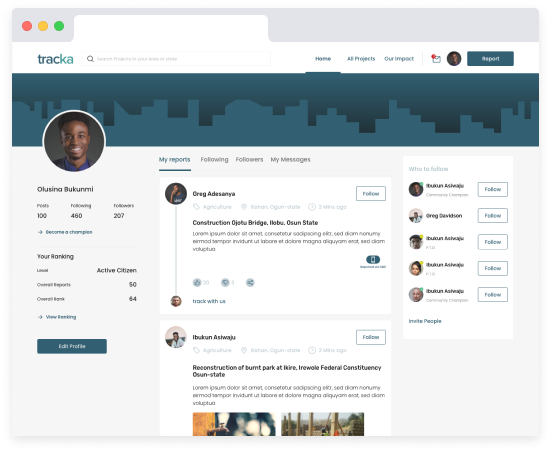
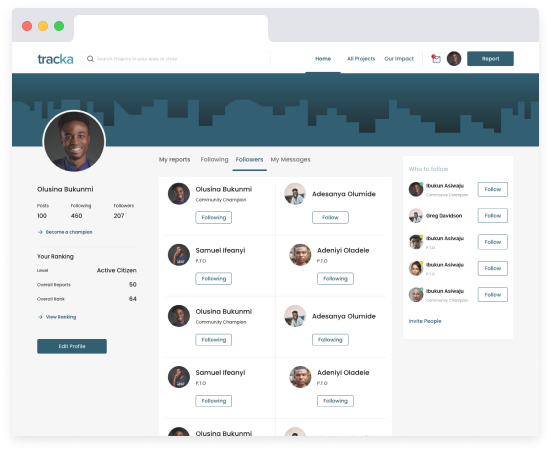
Community Engagement View
Project Notifications

Map View and Discovery